Ecommerce Conversion Rate Optimization: How to Turn Traffic Into Revenue
.png)
Ecommerce has never had a traffic problem. It has a conversion problem. Brands push more visitors into leaky funnels and wonder why revenue refuses to move. The truth is simple: until you understand what stops people from buying, no amount of traffic will save you.
CRO is about turning existing demand into dollars by tightening the entire buying journey. Not guessing, not copying trends, and definitely not relying on “quick wins.” When you treat optimization as a system instead of a set of tricks, your growth flips from unpredictable to repeatable.

What Is Ecommerce Conversion Rate Optimization (And Why Most Brands Get It Wrong)
Most ecommerce brands treat conversion rate optimization like interior decorating. They'll adjust button colors, tweak headlines, and shuffle page elements around, hoping these surface changes will somehow transform their revenue. Here's the thing though - this approach completely misses the point. Conversion rate optimization isn't about applying cosmetic fixes. It's about removing systemic friction from your growth engine.
Real CRO is a diagnostic process. You identify why your existing traffic isn't converting, then systematically remove the specific barriers that prevent purchase decisions. When brands focus on symptoms instead of root causes, they end up chasing improvements that look good on paper but don't translate to sustainable revenue growth.
Defining Conversions and Baseline Performance
Before you optimize anything, you need to define what conversion actually means for your business. Sure, completed purchases matter most. But micro-conversions tell a deeper story. Email signups, cart additions, product page engagement - these reveal exactly where your funnel breaks down. These intermediate actions show you whether your traffic quality matches your offer and where purchase intent starts evaporating.
You can't improve what you don't measure. Establishing baseline performance means knowing your numbers across the entire funnel. Average ecommerce conversion rates typically range from 2.5% to 3.1% across industries globally, with the twelve-month average as of late 2024 and into 2025 reported at 3.06%, according to Dynamic Yield benchmarks.
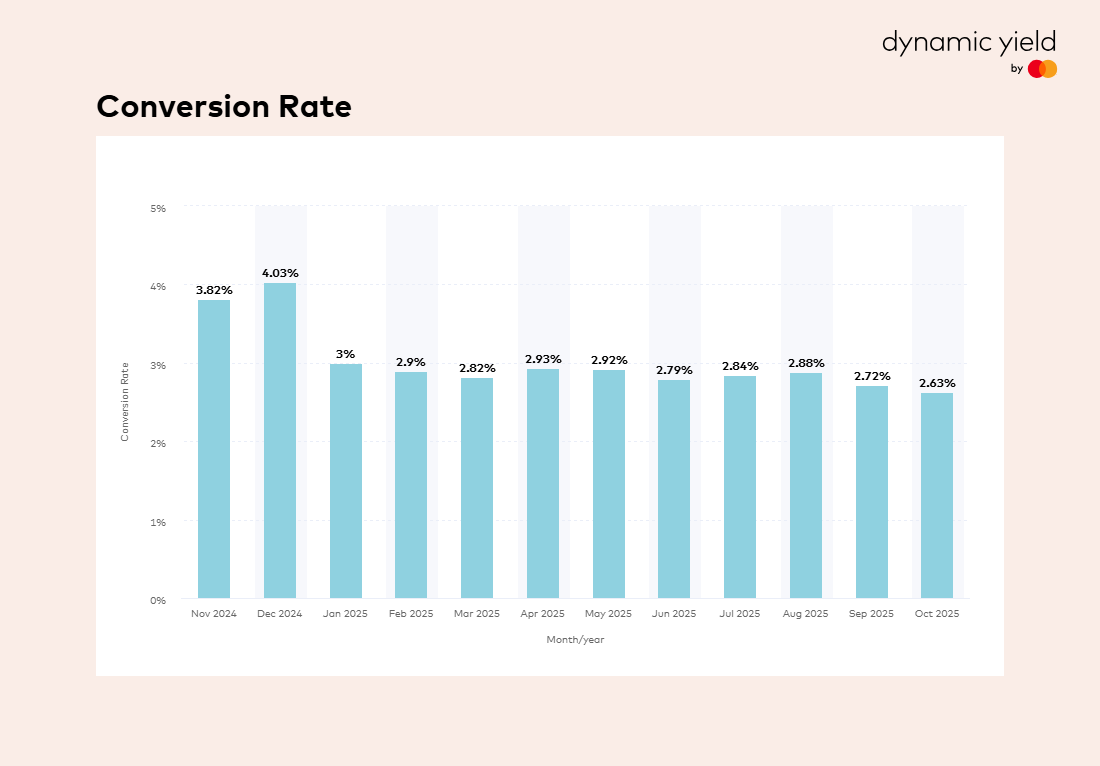
Here’s how different ecommerce industries actually stack up when it comes to conversion rates.
A conversion rate above 3.2% places you in the top 20%, while 4.8% or higher represents exceptional performance (Shopify).
Benchmarks are useful, but your trajectory matters more. To see where you're leaking revenue, track conversion rates by device, source, and customer segment. For example, you might see 5.06% conversion on desktop but only 2.49% on mobile. That wouldn’t be shocking as desktop typically converts better. But here’s the catch: mobile often drives around 65% of your total traffic, while desktop accounts for just 32%. So if you're optimizing mainly for desktop because “it converts better,” you're actually tuning the part of your funnel that matters least. The real gains come from improving where most people actually shop, on mobile (Dynamic Yield).
Diagnosing System Breakdowns, Not Just Symptoms
When conversion rates stagnate or decline, most brands react predictably. They throw more traffic at the problem or launch random A/B tests. Effective CRO starts with systematic diagnosis of where your funnel actually leaks revenue.
Your site isn't just "underperforming." Specific touchpoints create friction that compounds across the entire journey. A classic example? Mobile users hammering a disabled checkout button because the form never tells them what’s missing. When error states hide behind silence, conversions die fast.
The Metrics That Actually Reveal Friction
Forget vanity metrics like page views or time on site. The metrics that matter reveal where intent drops off and why. Start with add-to-cart rates on product pages. If users engage with your content but don't add products, something in your value proposition, trust signals, or product information is failing them.
Cart abandonment rate tells you whether your checkout process creates hesitation. But you need to segment this data. By device. By traffic source. Mobile shows the highest cart abandonment at 85.65%, compared to desktop at 73.76% and tablet at 80.74% (Shopify). High mobile abandonment with normal desktop rates points to mobile UX issues, not pricing concerns.
Tip: Use tools like Hotjar and Microsoft Clarity for session recordings and heatmaps. Focus recordings on sessions where users added to cart but didn't complete checkout (filter for 'Cart Addition' event plus 'Did Not Purchase'). Watch for rage clicks (rapid repeated clicking), u-turns (navigating away then returning), and field hesitation (cursor hovering over form fields for 3+ seconds without entry). These behaviors reveal friction points that conversion rate data alone won't show you.
Mapping Your Conversion Funnel's Drop-Off Points
Build a detailed map of every step from landing to purchase. Product page view, add to cart, checkout initiation, information entry, payment submission, order confirmation. Use Google Analytics 4's funnel exploration report (Explore > Funnel exploration) to build your conversion path. Start with these segments: Device Category, Session Source/Medium, and User Type (new vs. returning).
Measure conversion rates between each stage and identify the biggest drop-offs. Most brands discover their funnel doesn't leak evenly. You might convert 15% of visitors to cart but only 35% of those complete checkout. That 65% checkout abandonment rate? That's your primary revenue leak. For most ecommerce brands, if checkout abandonment exceeds 65%, prioritize checkout optimization before product page testing. Even if product page improvements seem easier.
Segment your funnel analysis by customer type. New visitors behave differently than returning customers. Traffic from paid search converts differently than organic or email. When you diagnose friction at this level, you stop implementing generic best practices. Instead, you start removing specific barriers for your actual audience.
Removing Friction From Core Conversion Touchpoints
Once you've diagnosed where conversions break down, address those specific friction points systematically. The strategies that work aren't about clever tactics. They're about making the path to purchase as smooth and confident as possible at each critical touchpoint.
Optimizing Product Pages That Guide Purchase Decisions
Product pages serve one purpose: give users everything they need to make a confident purchase decision. This means high-quality images that show the product clearly from multiple angles. Concise copy that addresses the primary use case. Trust signals that reduce purchase anxiety.
The biggest product page mistake? Overloading users with information instead of guiding their decision. Structure your product pages around the questions users actually ask: what does this do, will it work for me, what if I need to return it, and why should I trust this brand.
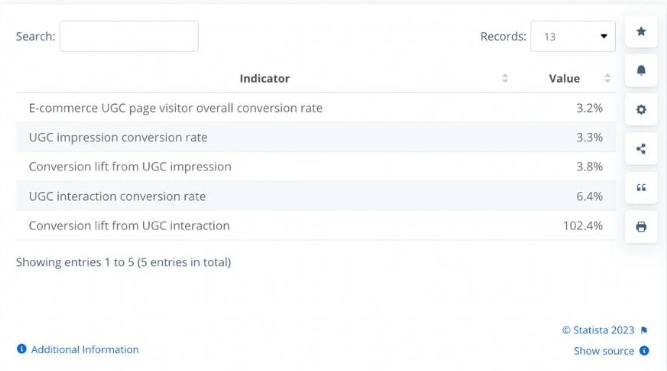
User-generated content dramatically impacts purchase confidence. Analysis of 1,200 websites by Statista revealed that UGC resulted in a 3.2% baseline conversion rate, which jumped by 3.8% when visitors scrolled through reviews and photos. Most striking: when users actively engaged with UGC, their likelihood of making a purchase doubled, increasing conversions by 102%. This isn't about cluttering your page with every review. It's about prominently featuring authentic customer experiences that validate your product claims and address common hesitations.
Streamlining Checkout to Eliminate Hesitation
Checkout is where intent meets friction. Every additional field, unclear step, or unexpected cost creates hesitation that kills conversions. The improvements that matter most here? Ruthlessly eliminate anything that doesn't directly contribute to completing the purchase.
Reduce form fields to absolute minimums. Offer guest checkout prominently. If your platform allows, implement address autocomplete using Google Places API or Loqate to reduce form friction. Hide coupon code fields behind a 'Have a promo code?' toggle link rather than displaying an empty field prominently. Visible empty coupon fields increase abandonment as users leave to search for codes they don't have.
Display shipping costs and delivery estimates early. Unexpected costs at checkout are a primary cause of abandonment. If your shipping pricing is complex, show estimates on product pages so users aren't surprised. Offer multiple payment options including digital wallets that reduce data entry. To address high mobile abandonment, offering free shipping or displaying costs upfront early in the checkout process can significantly boost conversion rates.
Checkout optimization can unlock major lifts in average order value and revenue. Pilothouse Digital’s work with KM Tools saw a 32% increase in AOV and a 20% boost in bottom-line revenue through frictionless purchase flows and trust-building page elements
Building Trust Throughout the Buyer Journey
Trust determines whether users complete purchases or bounce to competitors. Build trust systematically across the entire journey, not just at checkout. Start with clear, prominent trust signals: security badges, return policy information, and contact options on every key page.
Customer testimonials and case studies work best when they're specific and address common objections. Generic praise doesn't move the needle. Reviews that detail how products solved specific problems or exceeded expectations reduce purchase anxiety far more effectively. Place real-time support options like live chat on high-converting pages to answer questions exactly when users need them most.
Transparency about your business builds trust faster than any badge or testimonial. Clear shipping information, straightforward return policies, and accessible customer service contact information show you're not hiding anything. Brands that make it easy to reach a human when problems arise convert better because they reduce perceived risk.
Site-Wide Experience Optimization That Supports Conversion
Your conversion rate reflects the cumulative experience of your entire site, not just isolated touchpoints. Site speed, navigation clarity, and mobile responsiveness create the foundation that either supports or undermines every optimization you implement.
Page load time directly impacts conversion. A collaborative study from NitroPack with Google found that improving your website’s load time by just 0.1 seconds can increase conversions by 10.1% in travel, 8.4% in eCommerce, and 3.6% in the luxury sector. When users experience slow performance, they form negative expectations that color their entire journey. This makes them more likely to abandon even when later pages load quickly.
Mobile responsiveness isn't optional when mobile traffic represents your majority audience. But responsive design alone isn't enough. Mobile users need simplified navigation, larger touch targets, and streamlined content that acknowledges their context. Reading dense paragraphs on a small screen frustrates users. Optimize your mobile experience for quick scanning and decisive action, not desktop-style information density.
Navigation should guide users to conversion, not just organize your inventory. Structure your menu around user intent and common paths to purchase. Make your search functionality prominent and ensure it returns relevant results quickly. Users who can't find what they're looking for in seconds will leave, regardless of how well your product pages are optimized.
Testing With Strategic Intent, Not Random Experiments
Testing separates brands that improve systematically from those that optimize randomly. But most testing approaches focus on mechanics rather than strategy. Running tests is easy. Running tests that actually move revenue? That's hard.
Strategic testing means having a clear hypothesis about why a change will reduce friction and increase conversions. "Let's test a red button instead of blue" isn't a hypothesis. "Cart abandonment data shows users hesitate at this step, and a more prominent CTA should reduce that hesitation" is a hypothesis you can learn from regardless of test outcome.
Prioritize tests using frameworks like ICE (Impact, Confidence, Ease) or PIE (Potential, Importance, Ease). These methodologies force you to quantify expected revenue impact, your confidence in the hypothesis, and implementation difficulty. High-impact, high-confidence tests on important pages take priority over easy changes with questionable value.
Transformational gains don’t happen by accident. Pilothouse Digital’s full-funnel approach for RUX resulted in tripling ROAS and a 300% increase in ad spend, all while maintaining profitable scale during peak sales periods. Strategic hypothesis-driven testing, as seen with Journee’s 190% conversion rate increase through email optimization, compounds growth across channels by linking diagnostics to targeted improvements.
Prioritizing Tests for Maximum Revenue Impact
Not all tests are created equal. Testing headline variations on a low-traffic blog post won't move the needle. Testing checkout flow improvements on pages that handle thousands of daily sessions can transform your revenue. A/B testing on landing pages can increase conversions by as much as 30%, demonstrating that systematic testing of even minor elements delivers measurable ROI.
Calculate the potential revenue impact before running any test. If improving a product page conversion rate from 3% to 3.5% affects 10,000 monthly visitors with a $50 average order value, that's $25,000 in monthly revenue. Compare that to testing a feature page that gets 500 visits monthly. Even a dramatic conversion improvement there matters less than a modest improvement on high-traffic pages.
Run tests long enough to reach statistical significance. Declaring winners prematurely leads to false positives that waste resources on changes that don't actually improve performance. Use proper sample size calculators and don't stop tests early just because you see promising early results. Real conversion lifts reveal themselves through rigorous testing, not wishful interpretation of incomplete data.
Building Your Sustainable CRO System
Conversion rate optimization isn't a project with a finish line. It's an ongoing system that continuously identifies friction, tests solutions, and compounds improvements over time. Brands that build sustainable optimization strategies treat CRO as a core competency, not a periodic initiative.
Start by establishing a regular testing cadence. Prioritize your optimization checklist quarterly based on where your funnel shows the most friction. Document every test hypothesis, implementation, and result. This creates institutional knowledge that prevents repeating failed experiments and helps you spot patterns across successful tests.
Integrate conversion thinking across your organization. Your media buying team needs to understand how traffic quality affects conversion rates. Your creative team should know which messaging resonates based on product page testing. Your customer service team can identify friction points from user questions. When everyone contributes to identifying and solving conversion problems, your optimization engine compounds faster.
The brands that win at ecommerce conversion rate optimization don't chase tactics or copy competitors. They build systematic approaches to diagnosing friction, removing barriers, and testing improvements that connect directly to revenue growth. This requires commitment to continuous experimentation, cross-functional collaboration, and measuring what actually matters.
At Pilothouse Digital, we help brands move from tactical chaos to systematic growth engines. When you stop treating conversion optimization as a collection of tricks and start viewing it as diagnosing and removing friction from your entire system, you build sustainable improvements that compound over time. That's the difference between temporary lifts and long-term revenue growth.