


Facebook Ads Attribution Windows in 2026: What Changed and How to Read Your Numbers
Marketing directors staring at a Meta dashboard in spring 2026 saw something alarming: conversions cratered with no change in spend or creative. No bug caused this. Meta redefined what counts as a click, and separately shifted its delivery system toward outcome-based optimization, which pushed CPMs up across retail, lead-gen and ecommerce in the first two weeks of the rollout. Most of the reported drop is a labeling change. Some of the cost increase is not. Knowing which is which is what a marketing director needs in their back pocket before walking into any board meeting.

Meta's Mid-March 2026 Attribution Update: What Changed and Why Conversions Dropped Overnight
On March 3, 2026, Meta narrowed what counts as a "click" for attribution purposes. Link clicks now qualify under click-through attribution, while likes, shares, saves, comments, profile taps, and other non-link clicks moved into a separate "engage-through" category. This followed an earlier change on January 12, 2026, when Meta removed the 7-day view and 28-day view windows from the Ads Insights API. Those windows had not been selectable as ad set settings since 2021, but they remained available for reporting until January, which is why the drop landed in dashboards rather than in delivery. An analysis by Conversios tied that shift to an overnight reported-conversion drop of 15 to 40 percent, with no actual change in campaign performance behind it.
Engaged-Through Attribution Replaces Click-Reported Engagement
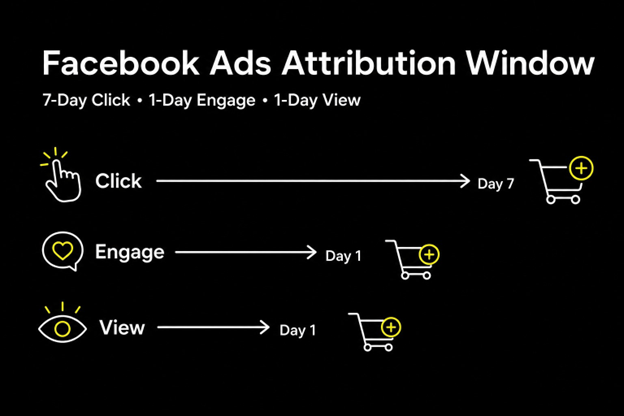
The new model, engage-through attribution, credits broader social interactions but on a fixed 1-day window, while click-through narrows to a Google-aligned definition of a direct link click. Meta renamed "engaged-view attribution" to "engage-through attribution," so the default setting now reads 7-day click, 1-day engage-through, 1-day view. The video threshold for engage-through qualification dropped from 10 seconds to 5, or 97% of runtime for shorter videos. Most of what you're seeing in the conversion columns is reclassification rather than lost sales, though a slice of conversions genuinely vanishes from reporting because engage-through can't stretch past 24 hours. Costs are a separate question: the delivery change that landed alongside the attribution update moved CPMs in many accounts, so don't tell the board the whole move was cosmetic.
The Reported Conversion Drop, Explained
Reported figures vary by account type. The March redefinition alone produced an immediate 15-30% drop in reported click-through conversions (DigitalApplied), with high-social-interaction accounts hit hardest.Dataslayer's analysis found 7-day-view users lost 15-30% of attributed conversions overnight, while 28-day-view users lost 30-40% (Dataslayer, cited in Lionel Fenestraz). Some accounts hit by both changes saw even larger combined swings in reported conversions. Brands switching from 7-day to 1-day click windows specifically can expect a further drop in reported conversions, since that shift excludes the entire 2-7 day consideration window.
Illustrative example. The table below shows the same campaign, same spend, reported under two different windows, purely to illustrate the mechanic:
Metric
7-Day Click / 1-Day View
1-Day Click Only
Ad spend
$50,000
$50,000
Reported conversions
1,000
650
Reported ROAS
4.0x
2.6x
Reported CPA
$50
$77
No spend, creative, or delivery changed between the two columns. Only the attribution window changed, and the conversions attributed 2-7 days after the click simply disappeared from the second column's count.
Who Got Hit Hardest by the New Facebook Ads Attribution Window Rules
Some accounts barely noticed. The brands most exposed were the ones whose reported performance depended on interactions that no longer count as clicks.
Social Proof-Heavy and Celebrity-Founder Brands
Brands built around social validation, comments and shares especially, saw their most visible engagement signals reclassified out of standard click reporting. The ads kept working just fine; the metric that used to capture their effectiveness simply doesn't exist in the same form anymore.
Accounts Running High-Engagement Video Creative
High-engagement video accounts absorbed a similar hit. Jacob, Head of Meta at Pilothouse, notes on Episode 591 of the DTC Podcast (Ep 591: Meta Andromeda Updates: CASC + AI Assistant + Creative Testing) that Meta's new ad-level creative testing tool lets advertisers split-test different landing page destinations under the exact same ad unit, whether that's a homepage, a collection page, or a pre-sale page. That structure keeps an ad's likes, comments, and social proof intact rather than fragmented across duplicate ad sets, which matters directly for accounts trying to preserve reported social signal under the new attribution rules.
Choosing the Right Facebook Ads Attribution Window for Your Business Model
The right facebook ads attribution window isn't universal. It depends on price point and how long a customer typically deliberates before buying.
Low-AOV, Low-Consideration Products: 1-Day View and Engaged-Through Fit
Impulse-priced, low-cost products fit a 1-day click window well. A 1-day view window suits flash sales and limited-time discounts particularly well, since the purchase decision happens fast. These are exactly the scenarios where engaged-through attribution and shorter conversion windows make sense.
High-Consideration Brands: Why Multi-Touchpoint Tracking Matters More
High-consideration, higher-priced purchases need the widest window Meta still offers: 7-day click, paired with 1-day engage-through and 1-day view. That combination is also the current default in Ads Manager, so most accounts are already running it. Available ad set windows today are 1-day click, 7-day click, 1-day view, and a 1-day engage-through window that now covers all formats rather than video only, though the engaged-view component no longer applies to image ads.
The 28-day click option was removed as an ad setting on January 19, 2021, when Meta replaced the account-level attribution window ahead of Apple's App Tracking Transparency rollout, which shipped with iOS 14.5 on April 26, 2021. It still exists for reporting: 28-day click conversions remain viewable through Compare Attribution Settings, even though the window is no longer available as an optimization element (Jon Loomer). The 7-day view and 28-day view windows were removed separately in January 2026.
The squeeze for high-consideration brands is the engage-through cap: it is fixed at 24 hours and cannot be extended, so a save or share that influences a purchase five days later is credited to nothing. Brands with long research cycles will systematically undercount the multi-touch reality of their customer journey, which is the case for pairing platform reporting with incrementality testing or a first-party conversion record.
Inside Meta's Incremental Attribution: What It Measures and What It Doesn't
Attribution windows only tell you when to credit a conversion, nothing more. Incremental attribution goes further, digging into whether that sale would have happened without the ad at all.
Why Incremental Attribution Is a Model, Not an Experiment
Meta's incremental attribution applies counterfactual modeling: machine learning trained on Meta's library of past Conversion Lift experiments across thousands of advertisers, then applied to your campaigns in real time (Ads Uploader). It does not hold out a randomized control group in your account. That is a Conversion Lift study, a separate tool that requires dedicated setup, budget and weeks to run. The distinction matters at board level: incremental attribution gives you an instant estimate built from other advertisers' data, while a lift study measures your own. Meta has not published the statistical techniques or holdout percentages behind the model, so treat it as a directional input, not a measured result.
What Ghost Ads Reveal About Real Incrementality
Ghost ads work by logging when an ad would have been served to a user in the auction but withholding it, creating a control group that never actually sees the ad while still reflecting real auction conditions (Tinuiti). That design is the benchmark for causal measurement, because the control group is defined by the same auction dynamics that produced the exposed group.
Meta's incremental attribution is not this. It runs no experiment on your account and holds nobody out. Meta's own lift studies use randomized holdouts, but the always-on setting applies patterns learned from those past studies to your campaigns. Knowing the difference is what lets you answer the board question: is this measured, or modeled?
What Meta's Own Numbers Actually Say
Meta's published performance claims for incremental attribution have climbed with each model release. A January to June 2024 test across 45 advertisers and 11 verticals showed a 20%+ improvement in incremental conversions. At the 2025 Performance Marketing Summit, Meta cited a 46% performance lift from 37 conversion lift studies run July to October 2024 across 30 advertisers. In January 2026, after a Q4 2025 model update, Meta reported a 24% increase in incremental conversions versus its standard model (Ads Uploader). These measure different setups rather than contradicting each other, but none has been independently replicated, and every one of them comes from the platform being evaluated.
An independent audit from Seer Interactive across six-plus accounts and $1.05M in spend during April 2025 found Meta reported 87% of conversions as incremental, versus 67% when cross-referenced with GA4, a 20-point gap. Seer found the best incrementality came from refined mid-funnel audiences, and the worst from broad plus hyper-narrow retargeting combined. That test is now more than a year old, and the picture has moved since. Haus re-ran its own analysis of the setting in July 2026 and found the relationship had reversed: experiments from July 2024 to June 2025 favored standard attribution at a geometric mean of 0.80x, while experiments from July 2025 to June 2026 favored incremental attribution at 1.26x, with the improvement strongest among DTC-only brands and consistent regardless of brand size (Haus). Meta's model appears to be getting better. That does not resolve the self-reporting problem, but it does mean a 2025 read on this setting is no longer a current one.
Incremental Attribution as an Optimization Engine, Not Just a Metric
Incremental data shouldn't just sit in a report. Feeding it back into bidding decisions at the ad-set level actually changes outcomes.
Training Meta's Algorithm to Find Users Who Need a Touchpoint
Raphael Gi, Head of Strategic Growth and Partnerships at Pilothouse, explains on Ep 625: Brand Salience for DTC: Turning Creative Into Your Targeting Layer that Meta's Andromeda algorithm evaluates how ads affect the on-platform user experience, and accounts built around repetitive or low-quality creative get actively demoted in deliverability. Incremental attribution, used correctly, trains the algorithm to find users who genuinely need a touchpoint to convert, not just users who were going to buy regardless. That's a materially different targeting objective than pure ROAS maximization.
Why Brands Need Third-Party Multi-Touch Attribution
The "Platforms Grade Their Own Homework" Problem
Meta's reporting will always favor Meta. A platform measuring its own effectiveness has no incentive to undercount its contribution, and that's exactly why in-platform ROAS becomes indefensible at scale without an outside check.
Using Tools Like Triple Whale's Total Impact Model as a Second Opinion
Triple Whale's Total Impact model weights channel credit using post-purchase survey responses alongside first-party click data, which means it needs a connected survey tool to work as designed. Without survey data it behaves closer to a linear model. Triple Whale has since added Clicks & Deterministic Views for cross-channel analysis (Triple Whale). It is still a vendor model with its own commercial incentives, so treat it as a second opinion rather than ground truth.
Meta's own Ads Manager includes a "Compare Attribution Settings" feature, useful for reconciling reported numbers against a tracker or GA4 before making any budget decisions.
A basic reconciliation checklist should:
- Compare Meta's reported conversions against GA4 sessions-to-purchase and CRM order data weekly
- Flag any gap wider than 20 points between platform-reported and cross-referenced conversions
- Confirm whether the discrepancy tracks with a specific campaign type, like retargeting, before touching budgets
Uncovering Hidden Winners: Assist Ads with Low ROAS but High Downstream Value
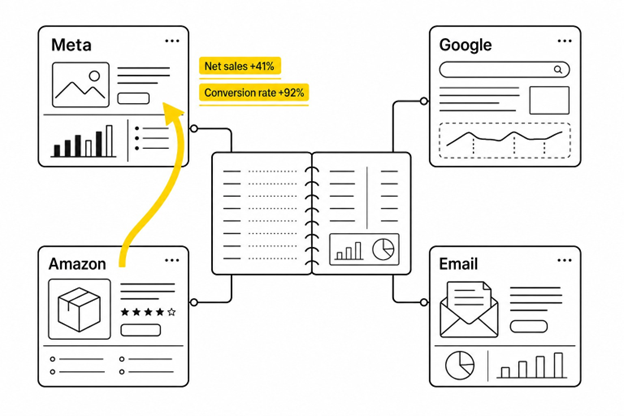
Last-click attribution systematically undervalues assist ads, the prospecting and awareness campaigns that introduce a customer to a brand without capturing the final sale. Longer-window, multi-touch measurement often reveals these campaigns are profitable at true contribution margin, even when their standalone ROAS looks weak. Pilothouse's work with VSSL shows what happens when channel budgets stop being fixed. Rather than evaluating Meta, Google, Amazon and email against their own separate targets, the team reviewed the full ecosystem weekly as a single P&L and asked where each dollar was driving the most incremental, profitable revenue at that moment. During Black Friday that meant shifting Amazon budget into Meta, because Meta was winning on new customer acquisition at a pace Amazon could not match. Spend stayed flat. Net sales grew 41% year over year and conversion rate improved 92% (Pilothouse). The gains came from reallocation, not budget.
The Profitable North Star: Shifting to Marketing Efficiency Ratio (MER)
Marketing Efficiency Ratio, total revenue divided by total marketing spend, gives a cleaner read on profitability than any single platform's ROAS. There is no universal healthy MER, because the number moves with revenue stage. A broad ecommerce benchmark sits at 3.0 to 5.0 (Human Marketing), but that range describes a mature brand, not a scaling one. By stage: $1-5M brands typically run 1.5-2.5 MER and often lose money on first order, $5-10M brands run 2.5-3.5, $10-25M brands run 3.0-4.5, and $25-100M brands run 3.5-6.0 or higher (Eightx). Judging a $3M brand against a 4.0 benchmark will make a healthy acquisition engine look broken. Blended MER and new-customer MER should be tracked separately, since they answer different questions.
Avoiding the Retargeting Death Spiral
Chasing platform ROAS often leads brands into a retargeting death spiral, pouring budget into warm audiences that show great last-click numbers but shrink the pool of new customers entering the funnel. Raphael's "12 cars, one gas tank" framing from Episode 625 applies here: spreading spend across too many narrow, product-based segments means none of them reach real scale. Tracking new-customer acquisition cost and MER instead of platform ROAS keeps that spiral from starting.
Questions to bring to the next board meeting:
- Which attribution window is set at the account level, and does it match the actual sales cycle for the core product?
- How much does reported ROAS shift when cross-referenced against GA4 or CRM data over the last 30 days?
- Which campaigns look weak on last-click ROAS but show strong assist value in a multi-touch view?
Get Expert Help Optimizing Your Meta Ads Attribution Strategy
At the $10M+ mark, attribution literacy stops being a nice-to-have. Board members expect marketing directors to explain why platform ROAS moved, not just report the number.
Pilothouse's Diagnostic Approach
Pilothouse's process starts by reconciling platform-reported metrics against actual business economics before any media or creative decisions get made. That means checking attribution window fit against the actual sales cycle, verifying reported conversions against GA4 and CRM data, and identifying which campaigns are true assists rather than dead weight.
Next Step
Brands ready to move past tactical firefighting and build reporting systems that actually hold up can review Pilothouse's case studies to see how that diagnostic process plays out in practice.

